NHC HURDAT2 · SPC Tornado Database
Hurricanes and Tornadoes That Hit Indialantic, FL
Every tropical system within 75 miles since 1851 and every tornado within 25 miles since 1950.
Data: NOAA NHC HURDAT2 and NOAA SPC tornado and hail reports, through 2025 · Updated
83 tropical systems have passed within 75 miles of Indialantic, Florida since 1851, 29 of them at hurricane strength; the most recent was Milton in 2024. Since 1950, 112 tornadoes have touched down within 25 miles, 2 of them rated EF3 or stronger.
- Hurricanes
- 29
- Tropical storms
- 54
- Tornadoes
- 112
- EF3 or stronger
- 2
within 75 mi, since 1851
below hurricane strength
within 25 mi, since 1950
12 deaths in all
What the records show for Indialantic
The strongest storm to pass near Indialantic was Matthew in 2016, a Category 3 hurricane with 123 mph winds when its centre passed 38 miles away. The closest pass by a hurricane was David in 1979, whose centre came within 3 miles. The record near Indialantic begins with an unnamed storm in 1852; the most recent system was Milton in 2024, a Category 1 hurricane 22 miles away. Of the 83 systems, 15 have come since 2000. Indialantic has more hurricanes within 75 miles than 67% of the 407 Florida cities on this site. The strongest of the 112 tornadoes within 25 miles was an F4 on April 4, 1966; its path came within 23 miles, and it killed 11 people. Of the 112, 26 had paths within 5 miles of the city centre, and 44 have come since 2000. September has had the most tornadoes, 23. The most recent tornado was on September 7, 2025. Of the 407 Florida cities, 57% have more tornadoes within 25 miles than Indialantic. Hail has been reported within 10 miles 82 times since 1974, with stones up to 2.5 inches (tennis ball size). Indialantic has more hail reports within 10 miles than 83% of the 407 Florida cities.
Compare Indialantic's storm record with another city →
Tropical storms and hurricanes near Indialantic
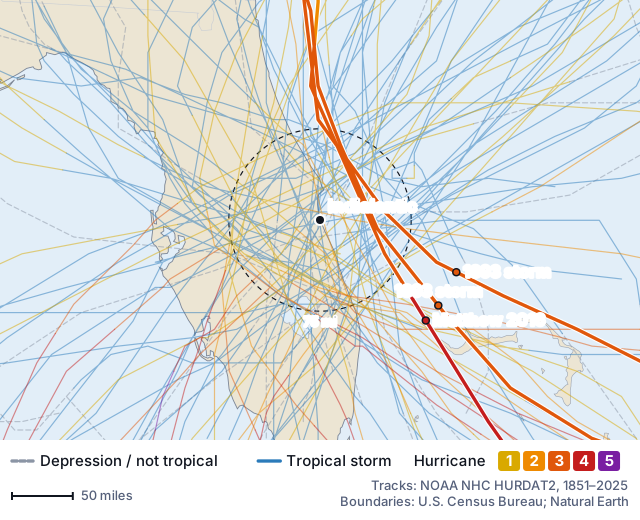
Of the 83 tracks on the map, 30 were moving northeast as they passed Indialantic, 22 northwest and 19 north. Matthew (2016), the strongest pass, was heading northwest; its centre passed 38 miles northeast of Indialantic. Within 75 miles of Indialantic, 18 of the 83 came ashore, 12 of them as hurricanes. In the last 30 seasons (1996–2025), 16 came near Indialantic: 5.3 a decade, against 4.6 a decade from 1851 to 1995.
| Year | Storm | Closest | Strength when closest | Peak |
|---|---|---|---|---|
| 2024 | MiltonOct 10 | 22 mi | Category 1 (78 mph) | Category 5 |
| 2022 | NicoleNov 10 | 27 mi | Tropical storm (71 mph) | Category 1 |
| 2022 | IanSep 29 | 12 mi | Tropical storm (70 mph) | Category 5 |
| 2022 | AlexJun 4 | 59 mi | Tropical storm (46 mph) | Tropical storm |
| 2020 | IsaiasAug 3 | 54 mi | Tropical storm (69 mph) | Category 1 |
| 2016 | MatthewOct 7 | 38 mi | Category 3 (123 mph) | Category 5 |
| 2016 | JuliaSep 13 | 10 mi | Tropical storm (40 mph) | Tropical storm |
| 2008 | FayAug 20 | 2 mi | Tropical storm (56 mph) | Tropical storm |
| 2006 | ErnestoAug 31 | 8 mi | Tropical storm (40 mph) | Category 1 |
| 2005 | TammyOct 5 | 26 mi | Tropical storm (46 mph) | Tropical storm |
| 2005 | OpheliaSep 8 | 69 mi | Tropical storm (63 mph) | Category 1 |
| 2004 | JeanneSep 26 | 51 mi | Category 2 (102 mph) | Category 3 |
| 2004 | FrancesSep 5 | 47 mi | Category 1 (87 mph) | Category 4 |
| 2004 | CharleyAug 14 | 59 mi | Category 1 (86 mph) | Category 4 |
| 2001 | GabrielleSep 15 | 39 mi | Tropical storm (46 mph) | Category 1 |
| 1999 | IreneOct 16 | 33 mi | Category 1 (75 mph) | Category 2 |
| 1995 | JerryAug 24 | 42 mi | Tropical storm (40 mph) | Tropical storm |
| 1995 | ErinAug 2 | 21 mi | Category 1 (79 mph) | Category 2 |
| 1994 | GordonNov 16 | 26 mi | Tropical storm (61 mph) | Category 1 |
| 1988 | KeithNov 23 | 16 mi | Tropical storm (43 mph) | Category 1 |
| 1988 | ChrisAug 28 | 36 mi | Tropical storm (46 mph) | Tropical storm |
| 1985 | BobJul 24 | 12 mi | Tropical storm (55 mph) | Category 1 |
| 1984 | IsidoreSep 27 | 46 mi | Tropical storm (52 mph) | Tropical storm |
| 1984 | DianaSep 9 | 63 mi | Tropical storm (58 mph) | Category 4 |
| 1983 | BarryAug 25 | 48 mi | Tropical storm (46 mph) | Category 1 |
| 1981 | DennisAug 18 | 20 mi | Tropical storm (40 mph) | Category 1 |
| 1979 | DavidSep 4 | 3 mi | Category 2 (98 mph) | Category 5 |
| 1976 | DottieAug 19 | 35 mi | Tropical storm (46 mph) | Tropical storm |
| 1974 | Unnamed 1974 stormOct 7 | 35 mi | Tropical storm (58 mph) | Tropical storm |
| 1969 | GerdaSep 8 | 59 mi | Tropical storm (40 mph) | Category 3 |
| 1968 | DollyAug 10 | overhead | Tropical storm (40 mph) | Category 1 |
| 1968 | BrendaJun 19 | 42 mi | Tropical storm (40 mph) | Category 1 |
| 1968 | AbbyJun 5 | 7 mi | Tropical storm (61 mph) | Category 1 |
| 1964 | IsbellOct 15 | 74 mi | Category 1 (92 mph) | Category 3 |
| 1964 | CleoAug 28 | 12 mi | Tropical storm (52 mph) | Category 4 |
| 1960 | FlorenceSep 24 | 40 mi | Tropical storm (53 mph) | Tropical storm |
| 1960 | DonnaSep 11 | 68 mi | Category 1 (76 mph) | Category 4 |
| 1959 | Unnamed 1959 stormJun 18 | 54 mi | Tropical storm (46 mph) | Category 1 |
| 1956 | Unnamed 1956 stormOct 16 | 8 mi | Tropical storm (58 mph) | Tropical storm |
| 1954 | Unnamed 1954 stormJun 20 | 66 mi | Tropical storm (40 mph) | Tropical storm |
| 1953 | HazelOct 9 | 28 mi | Tropical storm (72 mph) | Category 1 |
| 1953 | Unnamed 1953 stormJul 12 | 40 mi | Tropical storm (40 mph) | Tropical storm |
| 1952 | Unnamed 1952 stormFeb 3 | 71 mi | Tropical storm (63 mph) | Tropical storm |
| 1951 | HowOct 2 | 44 mi | Tropical storm (58 mph) | Category 2 |
| 1950 | KingOct 18 | 44 mi | Category 1 (86 mph) | Category 4 |
| 1949 | Unnamed 1949 stormAug 27 | 66 mi | Category 1 (94 mph) | Category 4 |
| 1948 | Unnamed 1948 stormSep 22 | 62 mi | Category 1 (92 mph) | Category 4 |
| 1945 | Unnamed 1945 stormSep 16 | 71 mi | Category 1 (83 mph) | Category 4 |
| 1939 | Unnamed 1939 stormAug 12 | 46 mi | Tropical storm (69 mph) | Category 1 |
| 1937 | Unnamed 1937 stormAug 30 | 56 mi | Tropical storm (67 mph) | Tropical storm |
| 1936 | Unnamed 1936 stormAug 21 | 43 mi | Tropical storm (58 mph) | Tropical storm |
| 1933 | Unnamed 1933 stormSep 4 | 56 mi | Category 2 (97 mph) | Category 4 |
| 1933 | Unnamed 1933 stormJul 30 | 69 mi | Tropical storm (61 mph) | Category 1 |
| 1928 | Unnamed 1928 stormSep 17 | 69 mi | Category 3 (112 mph) | Category 5 |
| 1928 | Unnamed 1928 stormAug 8 | 24 mi | Tropical storm (62 mph) | Category 2 |
| 1926 | Unnamed 1926 stormJul 28 | 17 mi | Category 2 (104 mph) | Category 4 |
| 1925 | Unnamed 1925 stormDec 1 | 3 mi | Tropical storm (64 mph) | Category 1 |
| 1921 | Unnamed 1921 stormOct 26 | 67 mi | Category 1 (81 mph) | Category 4 |
| 1921 | Unnamed 1921 stormOct 16 | 6 mi | Tropical storm (39 mph) | Category 1 |
| 1915 | Unnamed 1915 stormAug 1 | 26 mi | Category 1 (75 mph) | Category 1 |
| 1909 | Unnamed 1909 stormJun 29 | 59 mi | Tropical storm (40 mph) | Tropical storm |
| 1898 | Unnamed 1898 stormAug 2 | 75 mi | Tropical storm (40 mph) | Category 1 |
| 1897 | Unnamed 1897 stormSep 21 | 50 mi | Tropical storm (51 mph) | Tropical storm |
| 1896 | Unnamed 1896 stormOct 9 | 38 mi | Tropical storm (41 mph) | Category 2 |
| 1894 | Unnamed 1894 stormSep 26 | 62 mi | Category 1 (75 mph) | Category 3 |
| 1893 | Unnamed 1893 stormOct 12 | 47 mi | Category 3 (121 mph) | Category 3 |
| 1893 | Unnamed 1893 stormAug 27 | 40 mi | Category 3 (121 mph) | Category 3 |
| 1892 | Unnamed 1892 stormOct 25 | 2 mi | Tropical storm (45 mph) | Tropical storm |
| 1891 | Unnamed 1891 stormOct 7 | 56 mi | Tropical storm (46 mph) | Tropical storm |
| 1889 | Unnamed 1889 stormOct 6 | 48 mi | Tropical storm (47 mph) | Tropical storm |
| 1888 | Unnamed 1888 stormSep 8 | 69 mi | Tropical storm (40 mph) | Tropical storm |
| 1885 | Unnamed 1885 stormAug 24 | 20 mi | Category 1 (91 mph) | Category 2 |
| 1880 | Unnamed 1880 stormAug 29 | 6 mi | Category 2 (104 mph) | Category 2 |
| 1876 | Unnamed 1876 stormOct 20 | 26 mi | Category 1 (92 mph) | Category 3 |
| 1873 | Unnamed 1873 stormOct 7 | 12 mi | Category 1 (93 mph) | Category 3 |
| 1872 | Unnamed 1872 stormOct 23 | 50 mi | Tropical storm (46 mph) | Category 1 |
| 1871 | Unnamed 1871 stormAug 25 | 18 mi | Category 2 (96 mph) | Category 3 |
| 1871 | Unnamed 1871 stormAug 17 | 47 mi | Category 1 (91 mph) | Category 3 |
| 1870 | Unnamed 1870 stormOct 21 | 47 mi | Tropical storm (71 mph) | Category 2 |
| 1861 | Unnamed 1861 stormNov 1 | 4 mi | Tropical storm (63 mph) | Category 1 |
| 1859 | Unnamed 1859 stormOct 28 | 33 mi | Category 1 (85 mph) | Category 1 |
| 1858 | Unnamed 1858 stormSep 14 | 49 mi | Tropical storm (58 mph) | Category 2 |
| 1852 | Unnamed 1852 stormSep 12 | 25 mi | Tropical storm (58 mph) | Category 1 |
Strength is the sustained wind on the track at the closest point, which is not the wind felt in Indialantic: a hurricane's worst winds sit within a few dozen miles of its centre, and inland cities are usually past that.
Check hail and hurricane history for any address
Tornadoes within 25 miles of Indialantic
By decade
- 2020s8
- 2010s15
- 2000s21
- 1990s24
- 1980s14
- 1970s15(1 EF3+)
- 1960s10(1 EF3+)
- 1950s5
| Date | Rating | Distance | Path | Killed / injured |
|---|---|---|---|---|
| Apr 4, 1966 | F4 | 23 mi | 135.8 mi | 11 / 530 |
| Jun 19, 1972 | F3 | 19 mi | 4.9 mi | 0 / 0 |
| Nov 15, 1994 | F2 | 16 mi | 2.5 mi | 1 / 40 |
| Oct 24, 2005 | F2 | 5 mi | 0.3 mi | 0 / 0 |
| Mar 24, 1983 | F2 | 18 mi | 18 mi | 0 / 0 |
| Mar 7, 1983 | F2 | 3 mi | 5 mi | 0 / 0 |
| Sep 3, 1979 | F2 | 2 mi | 2 mi | 0 / 0 |
| Jul 9, 1979 | F2 | 15 mi | 0.5 mi | 0 / 6 |
| Jun 18, 1972 | F2 | 7 mi | 2 mi | 0 / 11 |
| Aug 4, 1971 | F2 | 9 mi | 4.1 mi | 0 / 0 |
| Feb 3, 1970 | F2 | 23 mi | 0.1 mi | 0 / 0 |
| Apr 4, 1966 | F2 | 20 mi | 123.3 mi | 0 / 0 |
The strongest 12 of 112, by rating and then by deaths. Ratings before February 2007 are on the original Fujita scale.
Hail in Indialantic
The Storm Prediction Center has 82 hail reports within 10 miles of Indialantic since 1974, made on 51 separate days. Of these, 46 were 1 inch across or larger, and 6 reached 2 inches. The largest, 2.5 inches (tennis ball size), fell on March 17, 2003. The most recent report is from May 24, 2025. April has the most reports, 19.
Source: NOAA Storm Prediction Center severe weather reports, data through 2025.
Weather by month in Indialantic
The nearest NOAA station with 1991–2020 climate normals is Melbourne International Airport, FL, 4 miles west of Indialantic at 22 feet. August is the warmest, with an average high of 89°F and low of 75°F; January is the coolest, at 72°F and 52°F. September is the wettest at 7.6 inches of precipitation on average and February the driest at 2.0 inches; the year adds up to 50.9 inches over 73 days with at least a tenth of an inch. June to November, the hurricane season months, bring 70% of the year's precipitation (35.4 of 50.9 inches); the other six months are drier. August has brought the most of the 83 tropical systems that passed within 75 miles (24); a normal August there has highs of 89°F and 6.7 inches of precipitation. Highs reach 90°F on about 63 days a year, almost all from April to October. Lows fall below freezing on about 2 nights a year. That 50.9 inches is more than at 23 of the 125 Florida stations used on this site (18%). Indian Harbour Beach, 5 miles north, has its own station (Melbourne WFO, FL): 55.3 inches a year, 4.4 more than here, and an August average high of 91°F against 89°F.
Water temperature at the NOAA tide station Trident Pier, Port Canaveral, FL, 22 miles north, averaged 87°F in September and 69°F in January over 2021–2025. It averaged 80°F or warmer from May to October. Sea level at the Port Canaveral tide gauge, 22 miles from Indialantic, has risen 2.52 ± 0.26 inches per decade from 1994 to 2025, NOAA's linear trend; at that pace it is 25.2 inches in a hundred years. That is faster than at 137 of the 144 U.S. gauges with a NOAA trend.
| Month | High °F | Low °F | Precip. in | Days ≥ 0.1" | Water °F |
|---|---|---|---|---|---|
| Jan | 72 | 52 | 2.6 | 4 | 69 |
| Feb | 74 | 54 | 2.0 | 4 | 71 |
| Mar | 77 | 58 | 2.7 | 4 | 75 |
| Apr | 81 | 63 | 2.3 | 4 | 79 |
| May | 85 | 69 | 3.5 | 5 | 83 |
| Jun | 88 | 73 | 7.1 | 10 | 85 |
| Jul | 90 | 74 | 6.5 | 10 | 87 |
| Aug | 89 | 75 | 6.7 | 10 | 86 |
| Sep | 88 | 74 | 7.6 | 9 | 87 |
| Oct | 84 | 69 | 4.9 | 6 | 83 |
| Nov | 77 | 61 | 2.6 | 4 | 77 |
| Dec | 74 | 56 | 2.4 | 4 | 72 |
| Year | 82 | 65 | 50.9 | 73 | 79 |
Averages for 1991–2020 at Melbourne International Airport, FL (22 ft), from NOAA NCEI U.S. Climate Normals; water temperature: average of hourly readings 2021–2025 at the NOAA tide station Trident Pier, Port Canaveral, FL, from NOAA Tides & Currents. Normals describe the station; the farther a place is from it, and the bigger the difference in height, the more its weather can differ.
Floods, thunderstorm wind and lightning near Indialantic
Since 1996, the National Weather Service has logged 122 flood, rain, thunderstorm wind and lightning events that began within 10 miles of Indialantic: 98 thunderstorm wind reports, 11 heavy rain events, 8 lightning strikes, 3 floods and 2 flash floods. They killed 3 people and injured 32, and the NWS estimated $5.6 million in property and crop damage. The strongest thunderstorm gust on record here was 89 mph, on July 23, 2003.
July 8, 2009: lightning strike 3 miles from the centre of Indialantic — 1 killed, 2 injured.
NWS: “A lightning strike directly hit and killed a man on Melbourne Beach. The lightning strike also injured the man's wife and son, who were transported to a local hospital and admitted in 'good condition' with only minor burns.”
July 28, 2017: lightning strike 7 miles from the centre of Indialantic — 1 killed, 1 injured.
April 16, 2023: lightning strike 9 miles from the centre of Indialantic — 1 killed, 1 injured.
Source: NOAA NCEI Storm Events Database, events whose starting point is on record, 1996 to June 30, 2026. Damage is the NWS estimate in the dollars of the year, not insured losses, and NWS notes that some reports are unverified.
Flood insurance claims, disaster declarations and FEMA risk ratings
Flood insurance policyholders in Indialantic's ZIP code 32903 have filed 299 claims with the National Flood Insurance Program since 1979, and were paid $2.8 million for buildings and contents, in the dollars of each year. The most came from Tropical Storm Fay in 2008: 57 claims (19% of all) and $483,000, then Hurricane Frances in 2004 with 45 and Hurricane Irma in 2017 with 42. The year with the most claims was 2004, with 84. 82% of the claims carry the name of a storm or flood event; the rest have no event name. Of the 340 Florida cities on this site with 10 or more claims, 174 have fewer than Indialantic.
| Event | Claims | Paid |
|---|---|---|
| Tropical Storm Fay2008 | 57 | $483,000 |
| Hurricane Frances2004 | 45 | $422,000 |
| Hurricane Irma2017 | 42 | $1.1 million |
| Hurricane Jeanne2004 | 33 | $634,000 |
| Flooding1995 | 26 | $1,617 |
| Hurricane Irene1999 | 15 | $3,909 |
Brevard County, which includes Indialantic, has been named in 45 federal disaster or emergency declarations since 1972, 26 of them major disasters (by incident: 24 hurricanes, 6 fires, 4 severe storms, 4 tropical storms). The latest major disaster declaration was Hurricane Milton, on October 11, 2024. FEMA's National Risk Index gives Brevard County a Relatively High rating for natural hazard risk overall; by hazard: Very High for hurricanes and lightning; Relatively High for tornadoes, inland flooding and strong wind; Relatively Moderate for coastal flooding and heat waves; Relatively Low for hail. It models the county's expected loss from all 18 hazards it covers at $389.3 million a year, the 8th highest of 67 Florida counties; of the hazards above, the largest share, $281.5 million (72%), is from hurricanes.
Claims: FEMA, OpenFEMA Dataset FIMA NFIP Redacted Claims – v3, summed over ZIP codes; payments in the dollars of each year, not adjusted for inflation. Declarations: Disaster Declarations Summaries – v2, by county. Retrieved October 25, 2026. This product uses the Federal Emergency Management Agency's OpenFEMA API, but is not endorsed by FEMA. The Federal Government or FEMA cannot vouch for the data or analyses derived from these data after the data have been retrieved from the Agency's website(s).
Risk ratings: FEMA, National Risk Index county table, December 2025 (v1.20), retrieved October 26, 2026; ratings compare counties nationwide, are meant for planning and are no substitute for a local risk assessment. This product uses the Federal Emergency Management Agency's National Risk Index dataset API or downloadable datasets but is not endorsed by FEMA. The Federal Government or FEMA cannot vouch for the data or analyses derived from these data after the data have been retrieved from the Agency's website(s).
What counts as a pass, the distances and the sources: how this storm history is built.
Cities near Indialantic
- Indian Harbour Beach, FL5 mi
- Melbourne, FL6 mi
- Melbourne Beach, FL7 mi
- Malabar, FL9 mi
- Palm Bay, FL9 mi
- Grant, FL12 mi
- Cocoa Beach, FL16 mi
- Barefoot Bay, FL16 mi
- Rockledge, FL17 mi
- Cape Canaveral, FL20 mi
- Merritt Island, FL20 mi
- Sebastian, FL22 mi
All Florida cities →All hurricanes since 1851 →Compare Indialantic with another place →