List of Hurricanes That Hit Pensacola, Year by Year
Data: NOAA NHC HURDAT2 and NOAA SPC tornado and hail reports, through 2025 · Updated
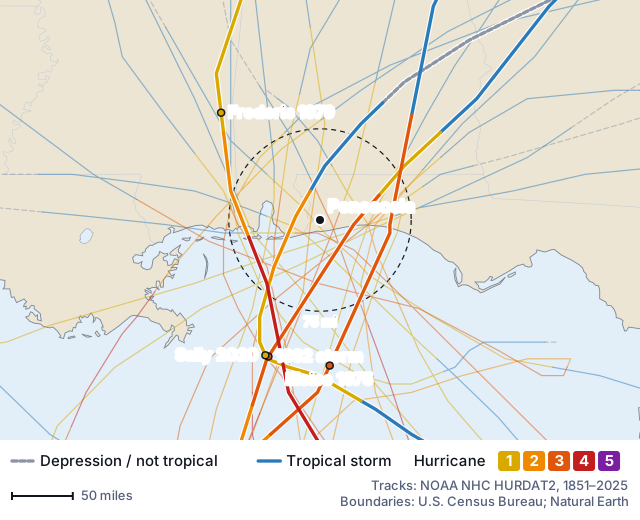
25 hurricanes passed within 75 miles of Pensacola at hurricane strength from 1851 to 2025: 18 of them within 50 miles and 8 within 25 miles. The most recent was Sally in 2020, 19 miles northwest of the city as a Category 1 hurricane; it came ashore 28 miles west of Pensacola. 21 of the 25 came ashore within 75 miles, 8 of them as major hurricanes (Category 3 or stronger at landfall).
- Hurricanes, 75 mi
- 25
- Came ashore nearby
- 21
- Most recent
- Sally 2020
- Longest gap
- 25 years
18 within 50 mi
8 as major
1852–1877
Every hurricane that passed within 75 miles of Pensacola
| Year | Storm | Date | Closest | Strength there | Pensacola on | Came ashore |
|---|---|---|---|---|---|---|
| 1852 | Unnamed 1852 storm | August 26 | 69 mi northwest | Category 1 (90 mph) | right side | — |
| 1877 | Unnamed 1877 storm | September 19 | 17 mi south | Category 1 (81 mph) | left side | 40 mi east, Category 1 |
| 1882 | Unnamed 1882 storm | September 10 | 25 mi southeast | Category 3 (127 mph) | left side | 28 mi east, Category 3 |
| 1887 | Unnamed 1887 storm | July 27 | 39 mi east | Category 1 (86 mph) | left side | 40 mi east, Category 1 |
| 1893 | Unnamed 1893 storm | October 2 | 63 mi northwest | Category 1 (81 mph) | right side | — |
| 1896 | Unnamed 1896 storm | July 7 | 45 mi east | Category 2 (98 mph) | left side | 46 mi east, Category 2 |
| 1911 | Unnamed 1911 storm | August 11 | 17 mi southwest | Category 1 (81 mph) | right side | 18 mi southwest, Category 1 |
| 1912 | Unnamed 1912 storm | September 14 | 66 mi southwest | Category 1 (75 mph) | right side | 68 mi west, Category 1 |
| 1916 | Unnamed 1916 storm | July 5 | 58 mi southwest | Category 3 (121 mph) | right side | 68 mi west, Category 3 |
| 1916 | Unnamed 1916 storm | October 18 | 7 mi west | Category 2 (107 mph) | right side | 9 mi southwest, Category 2 |
| 1917 | Unnamed 1917 storm | September 28 | 27 mi southeast | Category 3 (115 mph) | left side | 40 mi east, Category 3 |
| 1926 | Unnamed 1926 storm | September 20 | 11 mi south | Category 3 (115 mph) | right side | 18 mi southwest, Category 3 |
| 1932 | Unnamed 1932 storm | September 1 | 49 mi southwest | Category 1 (86 mph) | right side | 53 mi west, Category 1 |
| 1936 | Unnamed 1936 storm | July 31 | 31 mi northeast | Category 1 (86 mph) | left side | 40 mi east, Category 2 |
| 1950 | Baker | August 31 | 40 mi west | Category 1 (86 mph) | right side | 41 mi northwest, Category 1 |
| 1953 | Florence | September 26 | 63 mi southeast | Category 1 (92 mph) | left side | 64 mi east, Category 1 |
| 1956 | Flossy | September 24 | 26 mi southeast | Category 1 (92 mph) | left side | 52 mi east, Category 1 |
| 1975 | Eloise | September 23 | 57 mi southeast | Category 3 (125 mph) | left side | 58 mi east, Category 3 |
| 1979 | Frederic | September 13 | 60 mi west | Category 3 (123 mph) | right side | — |
| 1985 | Elena | September 2 | 49 mi south | Category 3 (120 mph) | right side | — |
| 1995 | Erin | August 3 | 4 mi southwest | Category 1 (82 mph) | centre within 5 mi | 11 mi south, Category 1 |
| 1995 | Opal | October 4 | 13 mi east | Category 3 (112 mph) | left side | 15 mi southeast, Category 3 |
| 2004 | Ivan | September 16 | 35 mi west | Category 2 (109 mph) | right side | 42 mi southwest, Category 3 |
| 2005 | Dennis | July 10 | 7 mi northeast | Category 3 (115 mph) | left side | 11 mi east, Category 3 |
| 2020 | Sally | September 16 | 19 mi northwest | Category 1 (93 mph) | right side | 28 mi west, Category 2 |
How often hurricanes reach Pensacola
The 25 hurricanes came in 23 different seasons. The median wait from one hurricane season to the next was 5.5 years; the longest, 25 years, ran from 1852 to 1877. 2 seasons brought two or more: 1916 (unnamed, July and unnamed, October) and 1995 (Erin and Opal). In the last 30 seasons (1996–2025) 3 passed within 75 miles of Pensacola at hurricane strength, against 5 in the 30 before (1966–1995) and 4.4 per 30 seasons from 1851 to 1965, when ships and coastal stations missed more storms.
The 1910s had the most hurricanes, 5. Tropical storms are the other 47 systems that passed within 75 miles below hurricane strength.
13 came in September, 5 came in July and 4 came in August. The earliest in the season was the unnamed storm of July 1916, on July 5; the latest, the unnamed storm of October 1916, on October 18.
Strongest passes and the side of the storm Pensacola was on
13 of the 25 passed with Pensacola on their right-hand side, where wind and surge are usually strongest, and 11 with the city on the left; 1 passed within 5 miles of the city centre. The strongest right-side pass was Frederic (1979), a Category 3 hurricane 60 miles west of Pensacola. The strongest at their closest point: the unnamed storm of September 1882 (Category 3, 127 mph, 25 miles away), Eloise (1975, Category 3, 125 mph, 57 miles away) and Frederic (1979, Category 3, 123 mph, 60 miles away).
Pensacola against nearby cities
Of the 7 cities compared here, Destin has the most hurricane passes within 75 miles (31) and Milton the fewest (22); Pensacola ranks 5th. Destin, 50 miles east, shares the fewest: 17 of its 31 hurricanes also passed within 75 miles of Pensacola at hurricane strength.
| City | Distance | Hurricanes, 75 mi | Within 50 mi | Shared with Pensacola | Strongest | Most recent |
|---|---|---|---|---|---|---|
| Pensacola, FL | — | 25 | 18 | — | Unnamed 1882, 127 mph | Sally 2020 |
| Gulf Breeze, FL | 16 mi northeast | 26 | 16 | 24 | Unnamed 1882, 127 mph | Sally 2020 |
| Navarre, FL | 22 mi east | 26 | 16 | 20 | Unnamed 1882, 127 mph | Sally 2020 |
| Milton, FL | 20 mi northeast | 22 | 16 | 21 | Unnamed 1882, 124 mph | Sally 2020 |
| Mobile, AL | 55 mi west | 24 | 17 | 16 | Elena 1985, 116 mph | Zeta 2020 |
| Gulf Shores, AL | 31 mi southwest | 29 | 20 | 23 | Unnamed 1882, 125 mph | Sally 2020 |
| Destin, FL | 50 mi east | 31 | 21 | 17 | Michael 2018, 159 mph | Sally 2020 |
- Pensacola's full storm record: all 72 tropical systems, tornadoes, hail and flood claims →
- Hurricane landfalls on the Gulf Coast, state by state →
How each figure on this page is counted: methodology.