Gulf Coast Hurricanes: Every Landfall Since 1851, State by State
Data: NOAA NHC HURDAT2 and NOAA SPC tornado and hail reports, through 2025 · Updated
From 1851 to 2025, the HURDAT2 landfall records add up to 203 hurricane landfalls on the U.S. Gulf Coast between the Rio Grande and the Florida Keys, by 193 storms; 66 came ashore as major hurricanes (Category 3 or stronger). Texas had the most, 57 (28%), and also the most major landfalls, 21.
- Texas
- 57
- Louisiana
- 50
- Florida west coast
- 43
- Florida Panhandle
- 32
21 major
17 major
13 major
9 major
Where hurricanes came ashore
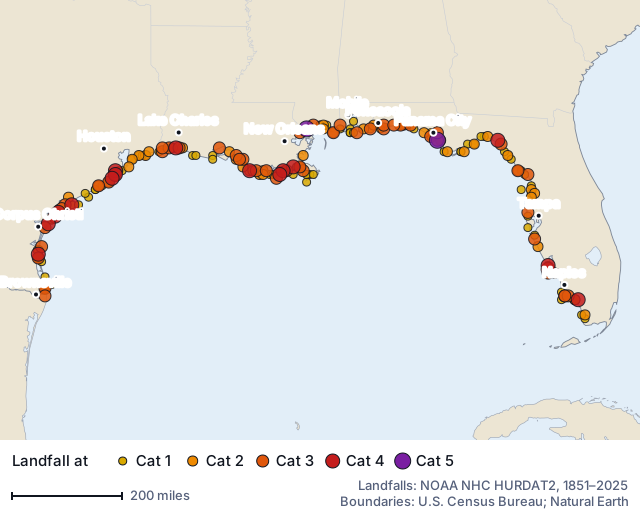
The busiest 100-mile stretch of the coast is centred 16 miles from Golden Meadow, Louisiana: 25 hurricane landfalls within 50 miles either side. 43 landfalls came in the last 30 seasons (1996–2025), 14.3 a decade, against 11.0 a decade from 1851 to 1995; the 1880s had the most, 17.
| Stretch | Landfalls | Major | Strongest | Most recent |
|---|---|---|---|---|
| Texas | 57 | 21 | Unnamed 1886, 150 mph | Beryl 2024 |
| Louisiana | 50 | 17 | Unnamed 1856, 150 mph | Francine 2024 |
| Mississippi | 10 | 3 | Camille 1969, 173 mph | Nate 2017 |
| Alabama | 11 | 3 | Unnamed 1916, 121 mph | Sally 2020 |
| Florida Panhandle | 32 | 9 | Michael 2018, 161 mph | Michael 2018 |
| Florida west coast | 43 | 13 | Charley 2004, 150 mph | Milton 2024 |
Landfalls by decade and month
Landfall records of one storm within 12 hours and 40 miles of each other (an island, then the mainland) count once; a storm that came ashore twice farther apart, as Katrina did in 2005, counts twice.
58% of Gulf hurricane landfalls came in August and September. The peak month differs along the coast: Texas August (16 of 57), Louisiana September (20 of 50), Mississippi September (5 of 10), Alabama September (5 of 11), Florida Panhandle September (11 of 32) and Florida west coast October (21 of 43). Of the 46 October landfalls, 28 were in Florida.
The strongest Gulf landfalls
| Storm | Date | Wind at landfall | Near |
|---|---|---|---|
| Camille | August 18, 1969 | 173 mph (Category 5) | Bay St Louis, MS (1 mi) |
| Michael | October 10, 2018 | 161 mph (Category 5) | Port St Joe, FL (15 mi) |
| Unnamed 1856 storm | August 10, 1856 | 150 mph (Category 4) | Chauvin, LA (32 mi) |
| Unnamed 1886 storm | August 20, 1886 | 150 mph (Category 4) | Rockport, TX (16 mi) |
| Unnamed 1932 storm | August 14, 1932 | 150 mph (Category 4) | Freeport, TX (9 mi) |
| Charley | August 13, 2004 | 150 mph (Category 4) | Bokeelia, FL (6 mi) |
| Laura | August 27, 2020 | 150 mph (Category 4) | Bell City, LA (25 mi) |
| Ida | August 29, 2021 | 150 mph (Category 4) | Golden Meadow, LA (12 mi) |
| Ian | September 28, 2022 | 150 mph (Category 4) | Bokeelia, FL (4 mi) |
| Carla | September 11, 1961 | 144 mph (Category 4) | Seadrift, TX (20 mi) |
| Galveston Hurricane of 1900 | September 9, 1900 | 138 mph (Category 4) | Danbury, TX (17 mi) |
| Celia | August 3, 1970 | 138 mph (Category 4) | Port Aransas, TX (2 mi) |
Gulf cities with the most hurricanes
| City | Hurricanes, 75 mi | Tropical storms | Most recent |
|---|---|---|---|
| Cut Off, LA | 38 | 44 | Francine 2024 |
| Clewiston, FL | 37 | 48 | Nicole 2022 |
| Larose, LA | 37 | 47 | Francine 2024 |
| Chauvin, LA | 37 | 47 | Francine 2024 |
| Houma, LA | 36 | 46 | Francine 2024 |
| Raceland, LA | 36 | 43 | Francine 2024 |
| Lockport, LA | 36 | 45 | Francine 2024 |
| Gray, LA | 35 | 45 | Francine 2024 |
| Moore Haven, FL | 34 | 47 | Nicole 2022 |
| Bonita Springs, FL | 33 | 47 | Ian 2022 |
| Galveston, TX | 33 | 33 | Beryl 2024 |
| North Fort Myers, FL | 33 | 50 | Milton 2024 |
| Thibodaux, LA | 33 | 43 | Francine 2024 |
| Naples, FL | 32 | 46 | Ian 2022 |
| Fort Myers, FL | 32 | 47 | Milton 2024 |
- List of Hurricanes That Hit Pensacola, Year by Year →
- Hurricanes That Hit Navarre, Florida, Year by Year →
- Destin Hurricane History: Every Hurricane Since 1851 →
- Panama City Beach Hurricane History, Year by Year →
- Baton Rouge Hurricane History: Every Hurricane Since 1851 →
- Lake Charles Hurricane History, Year by Year →
- List of Hurricanes That Hit Corpus Christi →
- Naples, Florida Hurricane History: Every Hurricane Since 1851 →
- Hurricanes That Hit Jacksonville, Florida, Year by Year →
How each figure on this page is counted: methodology.